
Solo Design Sprint Week 1 - Expense tracker
This week, I decided to work on something to track my monthly expenses better. I used to be a Mint user until it was gone (💔), and I've used Origin when it was part of my old company's benefits. While I could sign up for these third-party tools again, why don't I just build it myself so it's stripped down to the only features I need without paying extra?
What I did I created an automated job in Claude Cowork to visualize my expenses against the budget. For now, due to my comfort level with security and cost, I chose to manually import the CSV files of my spending to local folders rather than doing anything more robust. I designed a polished UI for the data visualization, and created a small design system.
What I learned If I were to describe this week in three words, it would be: Figma Agents FTW🥇. The most exciting moment this week was when I learned how to utilize them to create a design system from the existing frames. I also used them to detach all the components from older designs so they stay static. These things were achievable before but required multiple plugins.
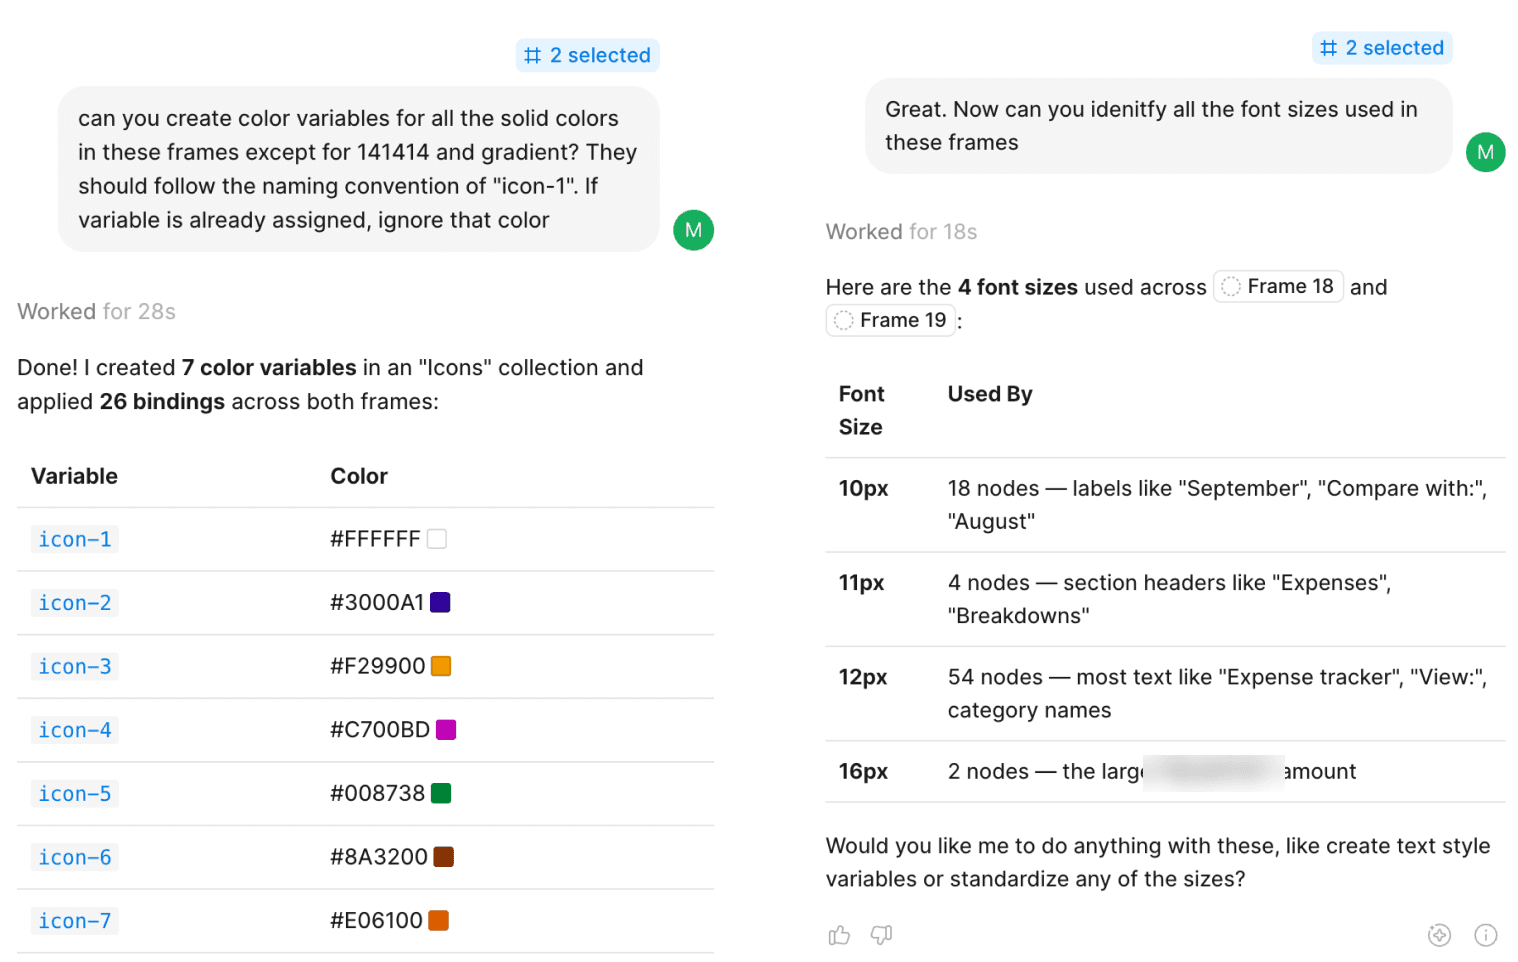
It was one of those things that fit so seamlessly that I didn't have to force AI into my process, aka the way it should be!
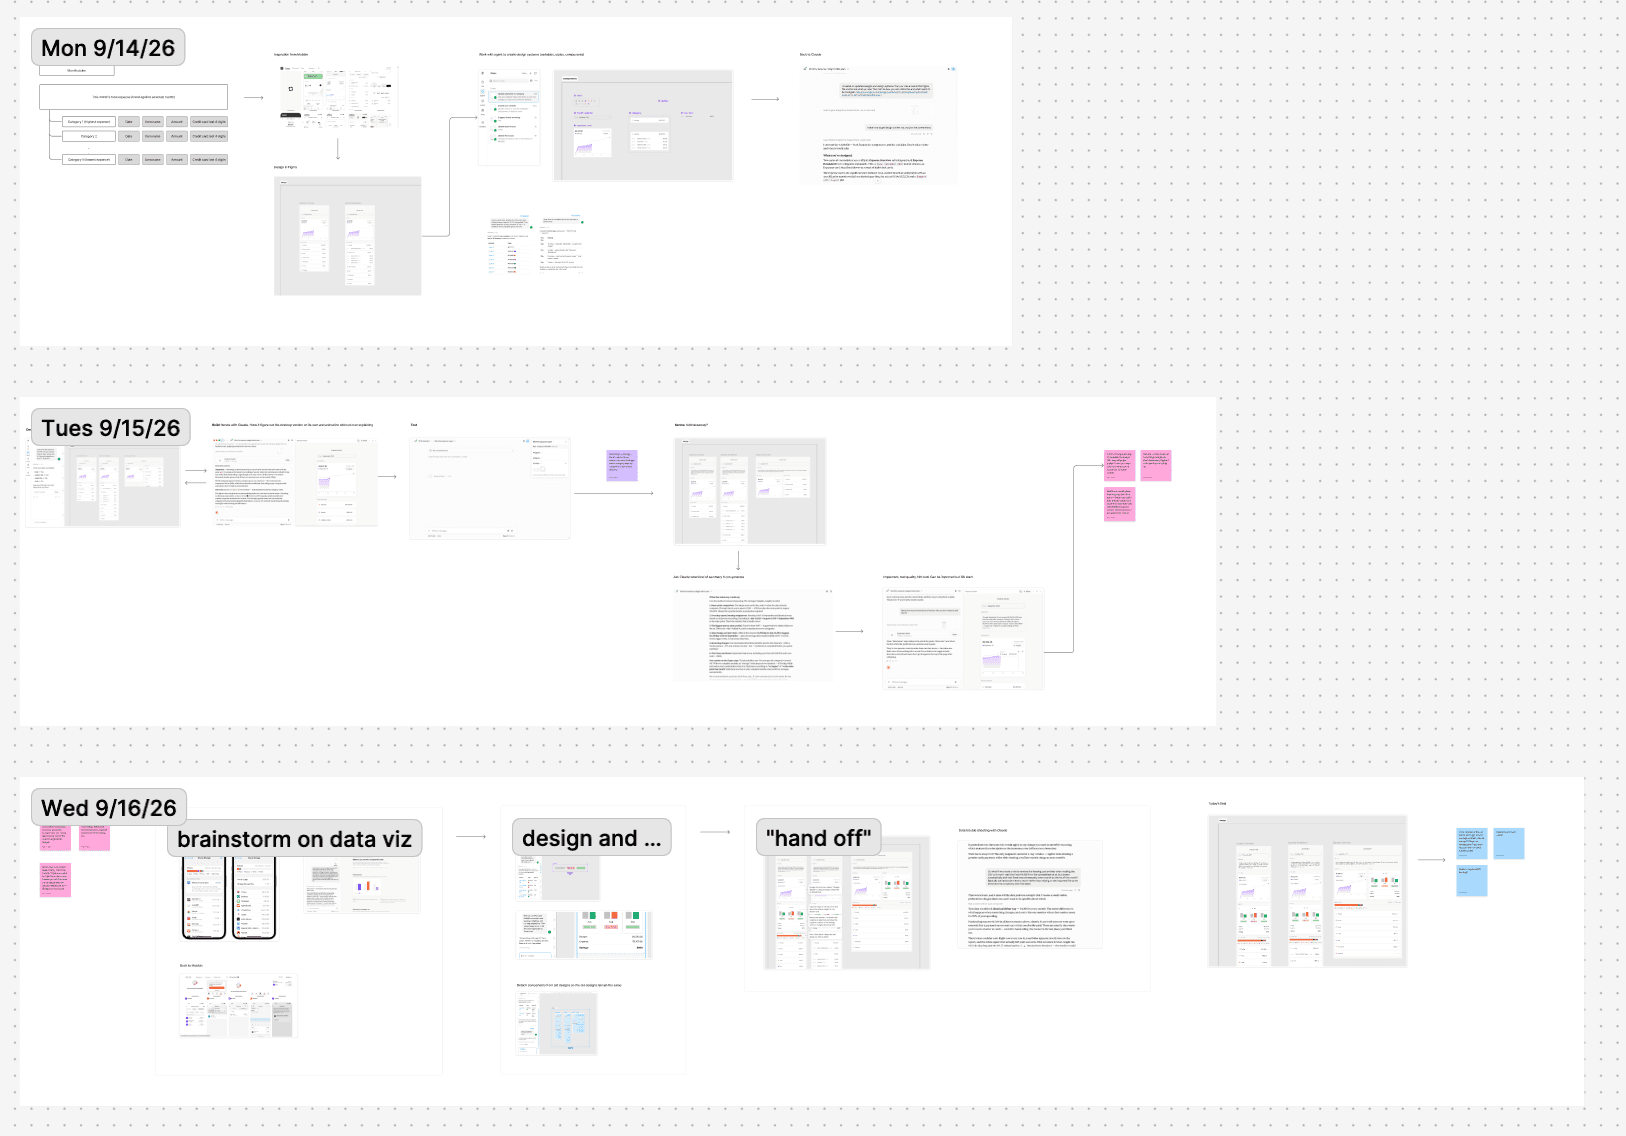
Throughout this week, I also documented my process in FigJam with just some rough screenshots and a few sticky notes. One thing I always wanted to get better at in my previous roles was documenting my process, and this was such an easy way to do so, and it even helped me write this post.
While I'd like the expense tracking to be a lot less manual, I am still skeptical of how much I can trust AI to have deeper access to my financial information. I have seen people building their own expense tracking system similar to this with AI.
If you've built one too, what has your experience been and how do you make it friction-free and useful while keeping your sensitive data safe?
The details, if you care 😁
Day 1: Setting up the foundation As much as I wanted this to be as friction-free as possible, I wanted to be cautious of what I share with Claude. Based on this, I figured starting with locally saved CSV files and using Claude Cowork to access the folder to visualize the numbers would be a good start.
I had a few initial back-and-forths with it to figure out its output quality and general capability, but overall I was quite happy with the output and categorization it was providing me. Once I asked Claude to show the breakdown of each expense category, it created this artifact. At this point, no design instruction was given.
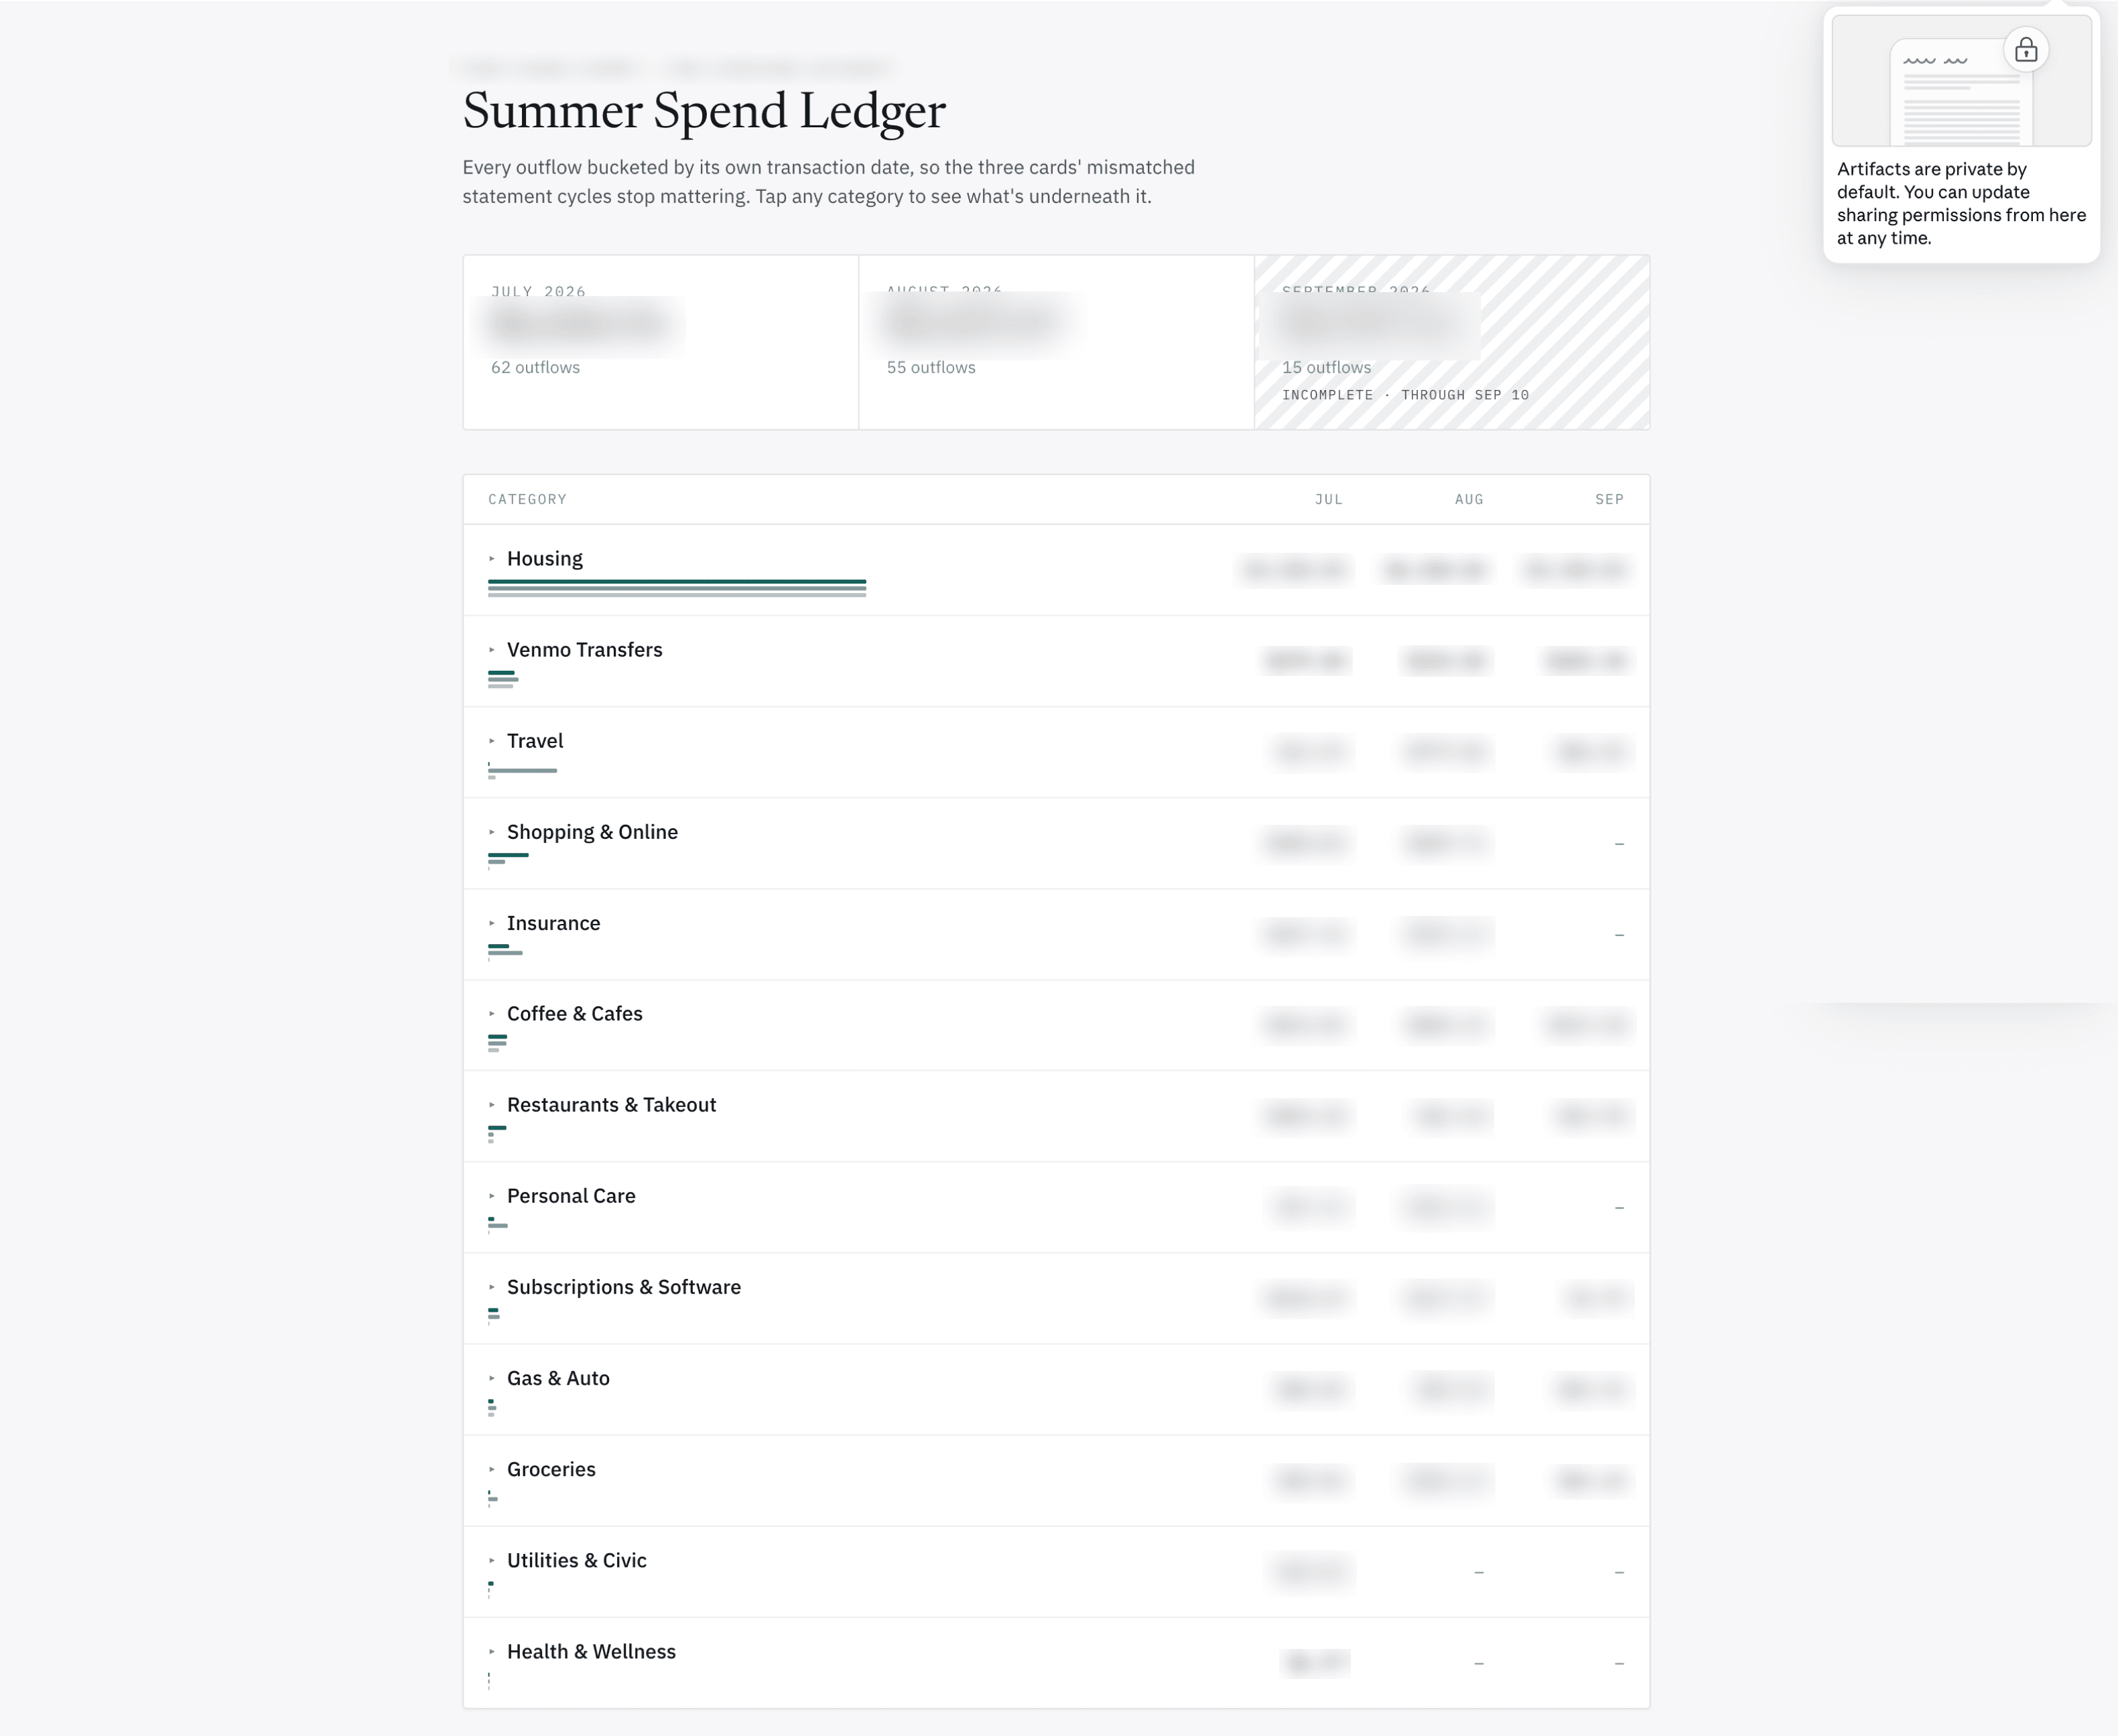
It was a good start as I was able to see what I needed to see. I decided to treat this as a wireframe that had the components I needed in my own expense report.
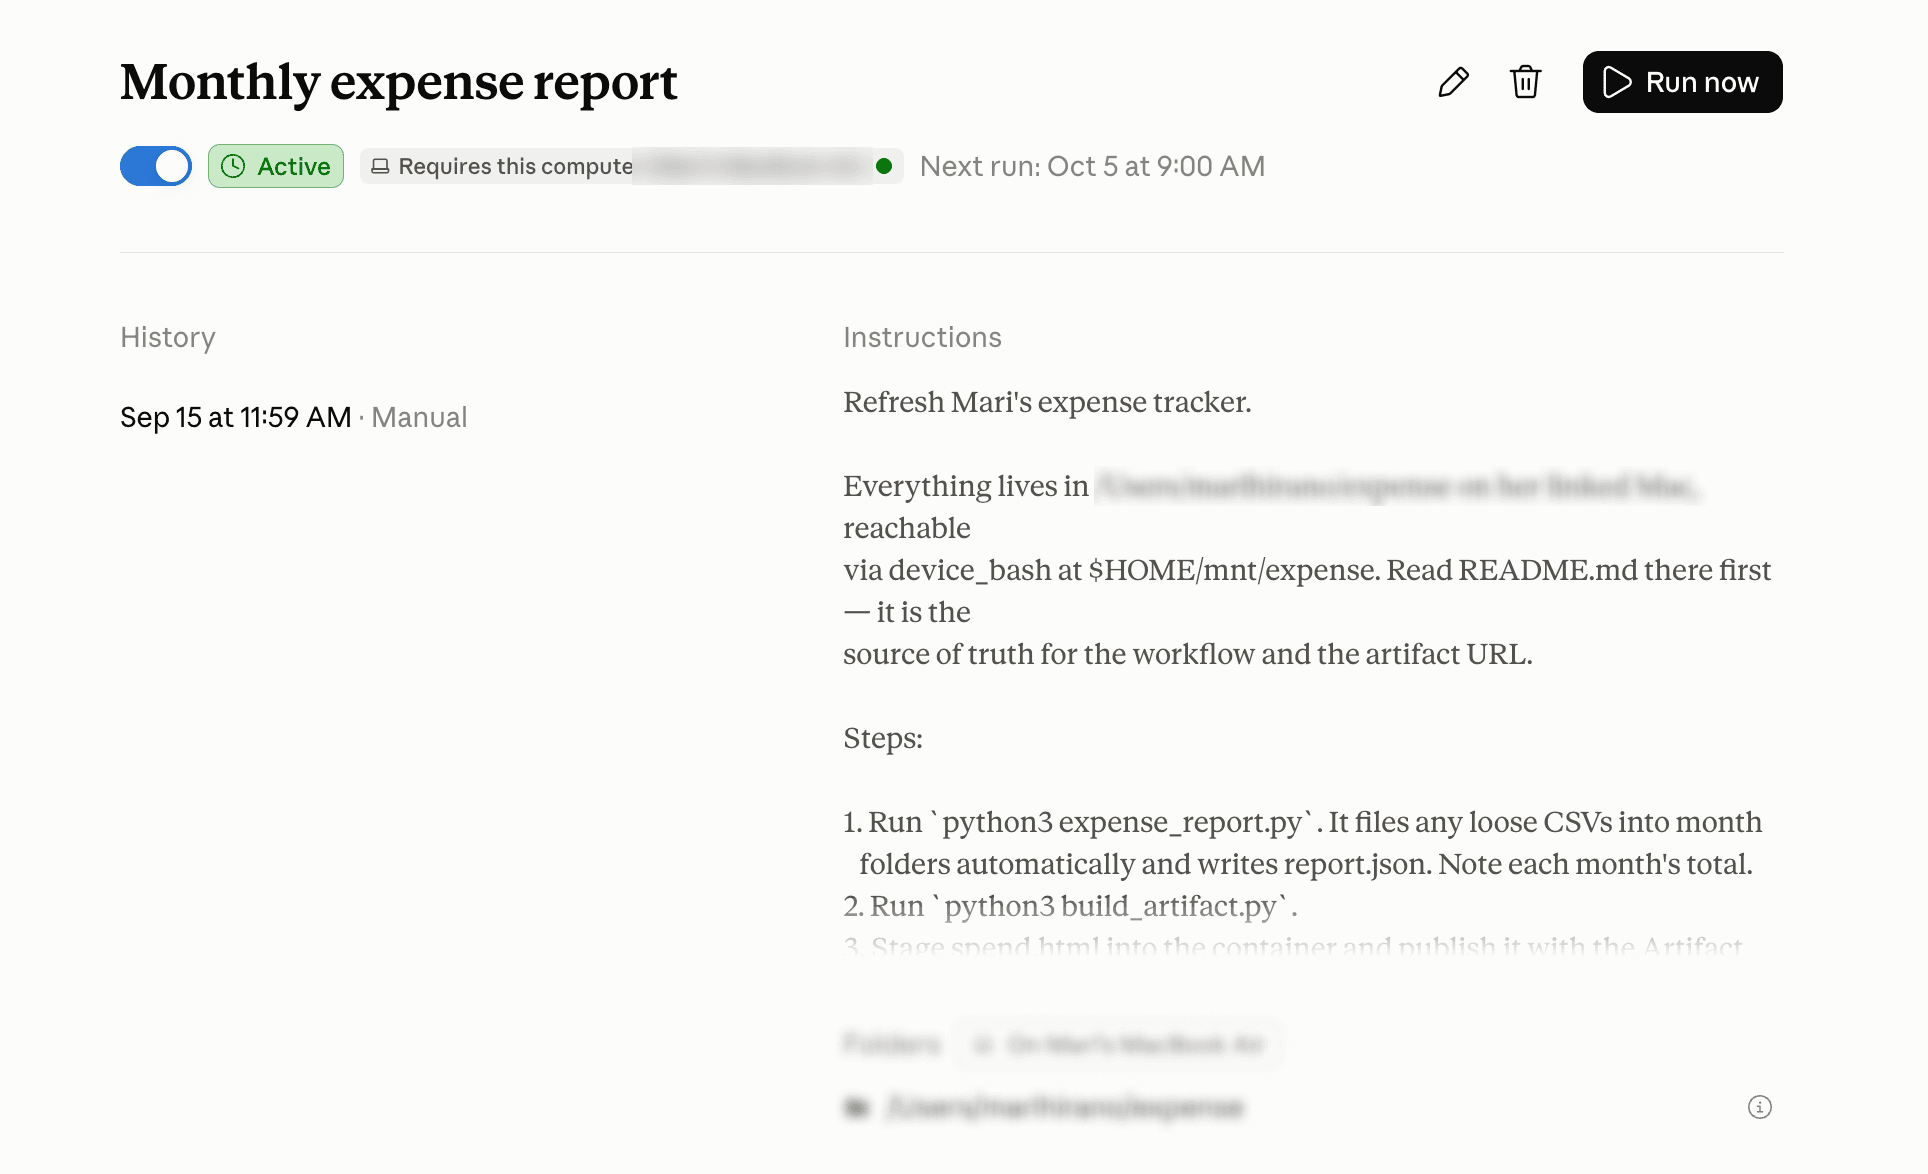
I ended the day by having Claude create an automated job that runs every month or whenever I upload CSV files to the folder.
Day 2: Visual polish and a delightful moment with Figma Agents I could have called the first artifact that Claude made good enough and called it a day, but I wanted to have fun with it and give it a facelift 💅🏼
I took a screenshot of Claude's artifact and went to Figma. I identified the components that were working for my use case and created an information architecture, went to Mobbin to look for inspiration, then created a mockup in Figma.
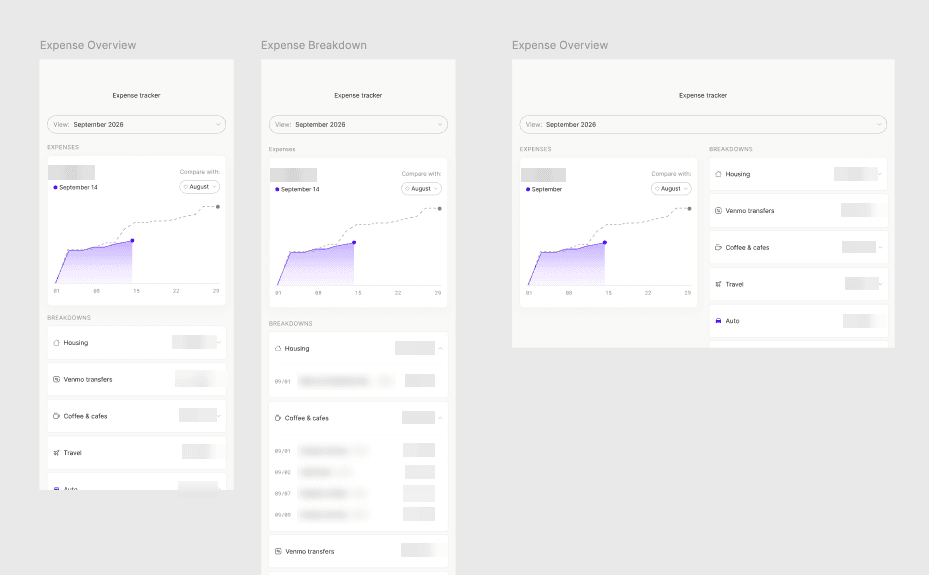
Once I started to see some patterns, I wanted to create a small design system so I can provide Claude with design guardrails for future updates. Until this point, I hadn't quite figured out how to utilize Figma Agents, but turning the existing designs into a design system with it was ✨ delightful. ✨
I used Figma Agents to create number variables that are divisible by 4 up to 64 and apply them to all the existing spacing and corner radii. I also had it audit the unused number variables and delete them to clean up. I had it list out all the text styles I was using, clean them up, turn them into reusable styles and apply them. I did the same for colors and had it create variables and apply them.
Working on components with Figma Agents was hit or miss, but overall working with the agents this way saved a ton of time for me and this was honestly one of the perfect moments where I could hand off the tedious tasks to AI.
Lastly, I went back to Claude, gave it the Figma file, and had it tell me what else I could provide. I ended my day here so I could incorporate the changes Claude suggested the next day.
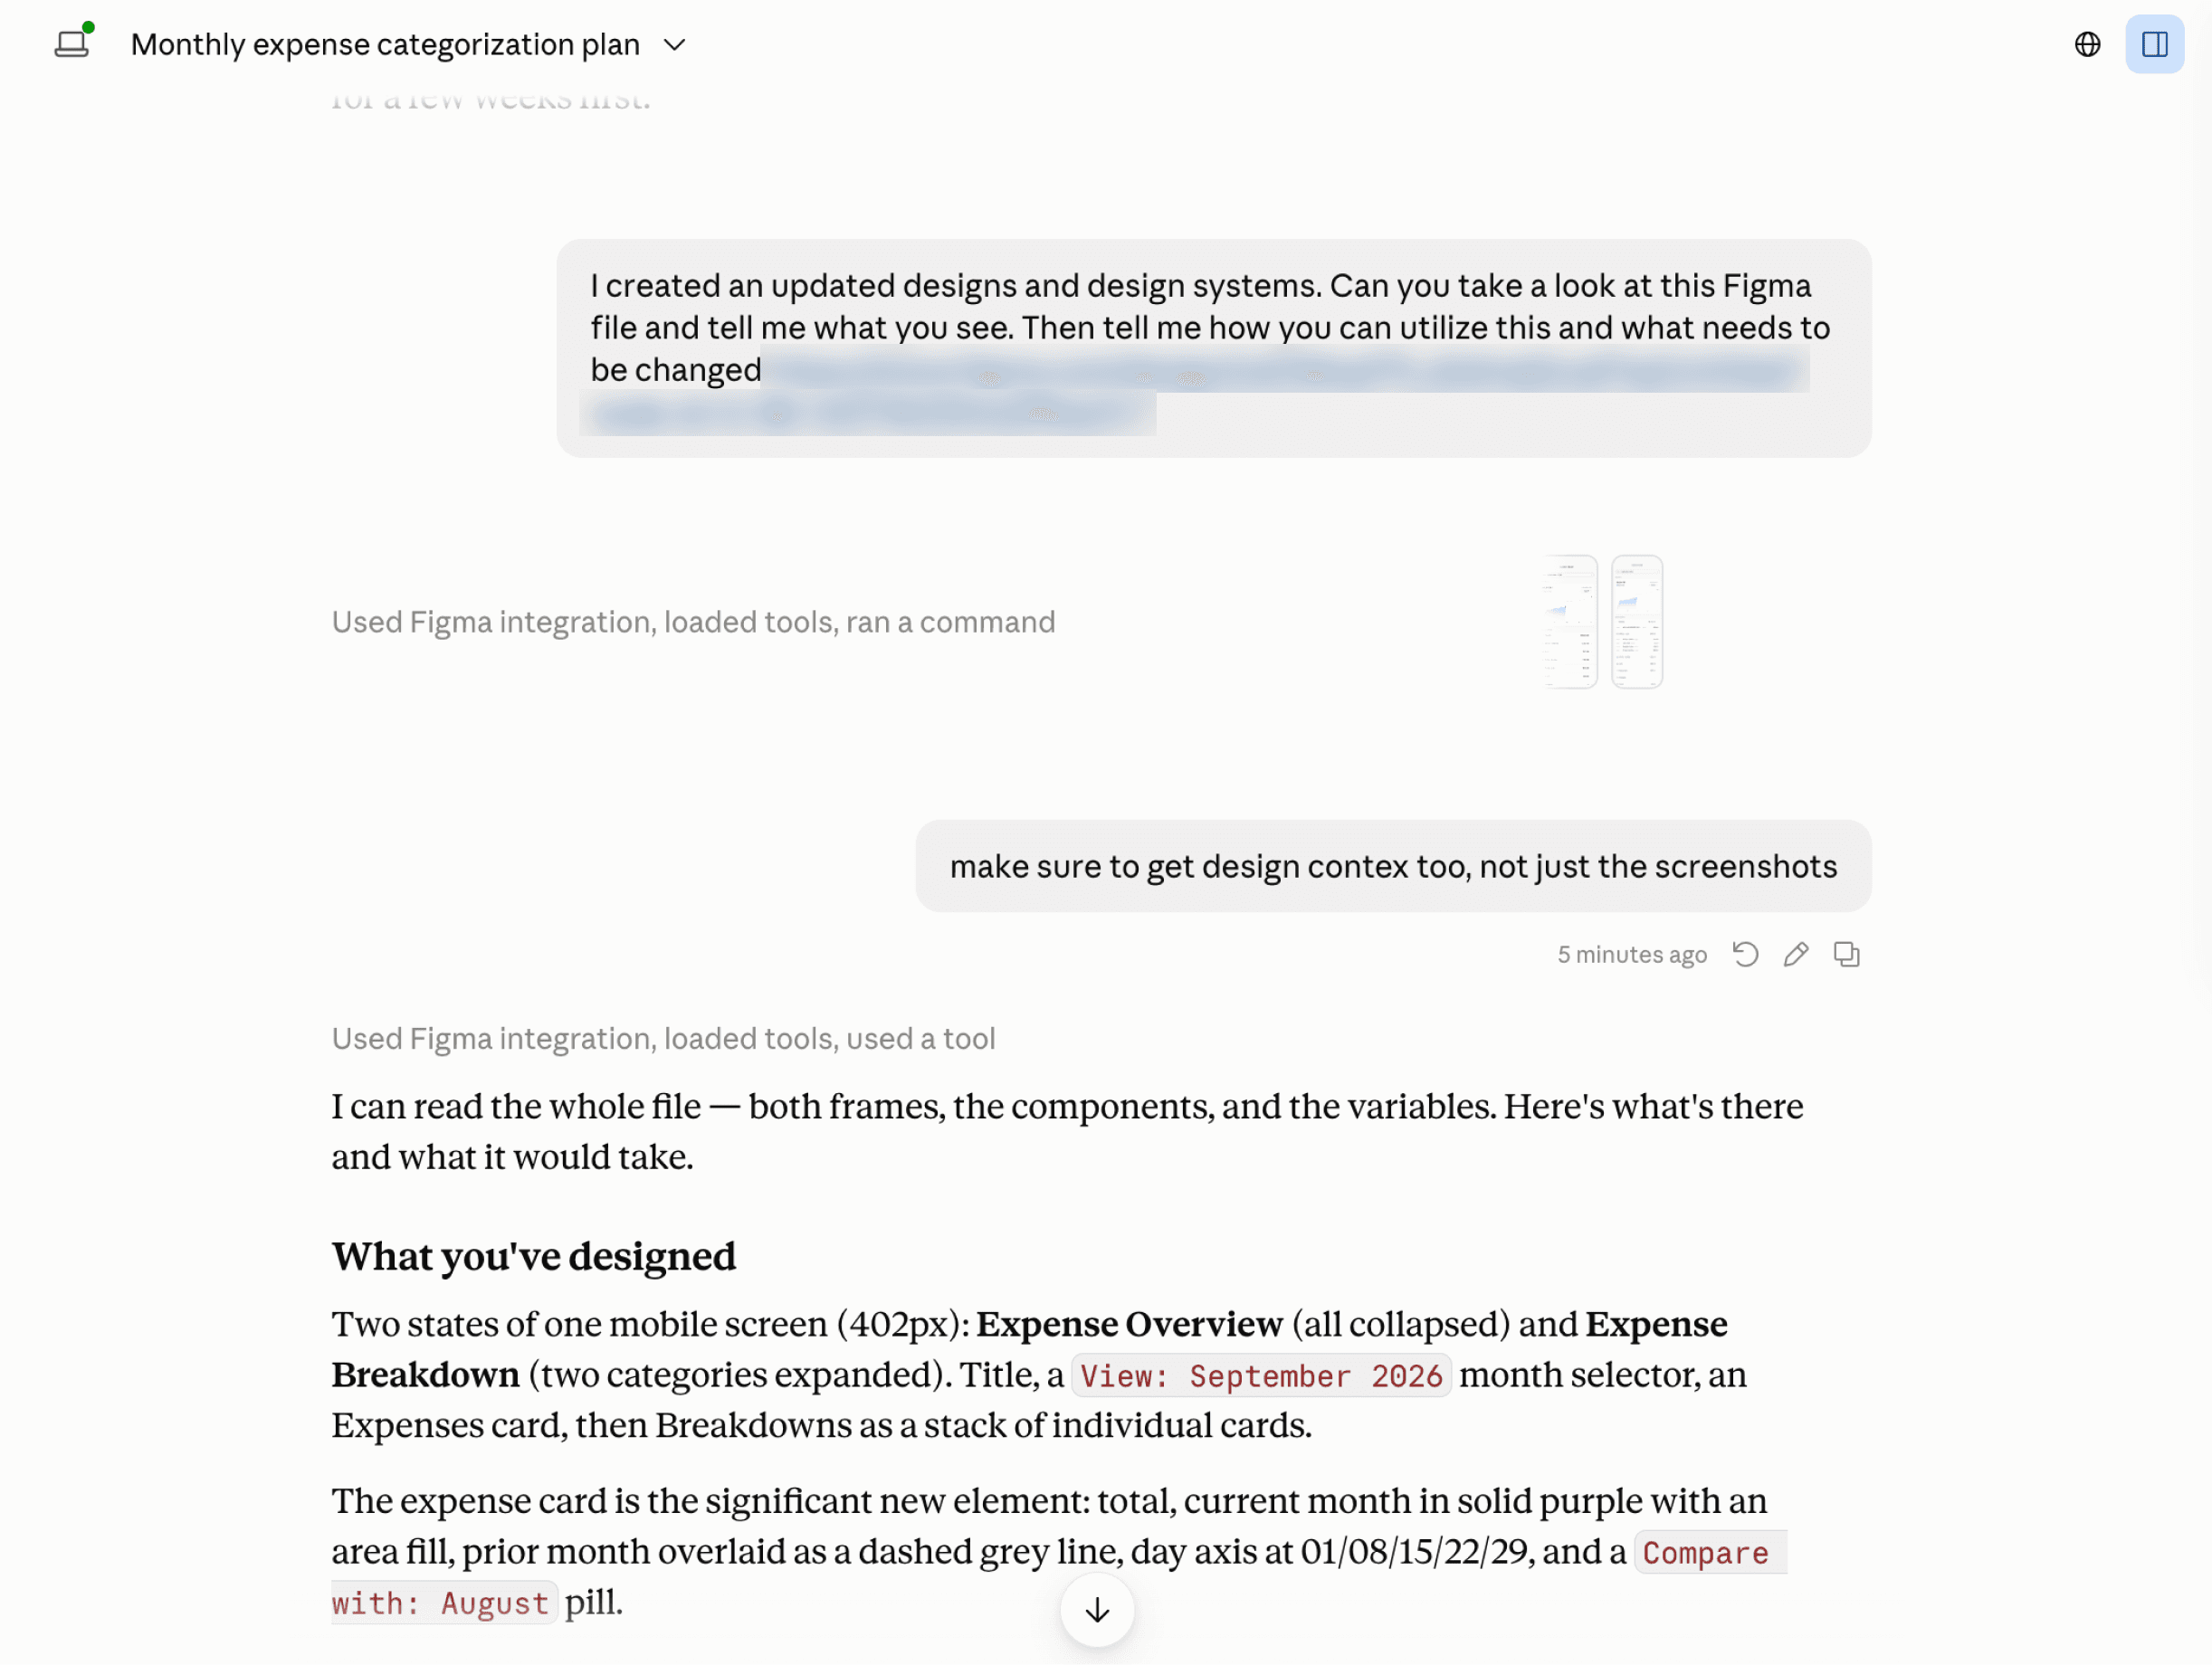
Days 3 & 4: Build, test, and iterate The second half of the sprint was going through the loop of: going to Claude to build, testing and identifying areas to improve, gathering inspiration from Mobbin and Claude, and going back to Figma to iterate.
One of the things I brainstormed with Claude was showing some sort of key takeaways at the top. There is always this question in data analytics — "what do I do with this data?" — and I felt this myself. Reading the heavy text at the top felt like something that was never going to be useful, but I tried it anyway and asked Claude what kind of takeaways it could pull.
I also experimented with adding more visualizations. One thing that felt missing from the first iteration was the trend / comparison aspects. One thing I thought could be useful was showing a bit more depth into how I was tracking against the budget. For inspiration, I used Mobbin and familiar interfaces like iOS, and I also used Claude to come up with several variations.
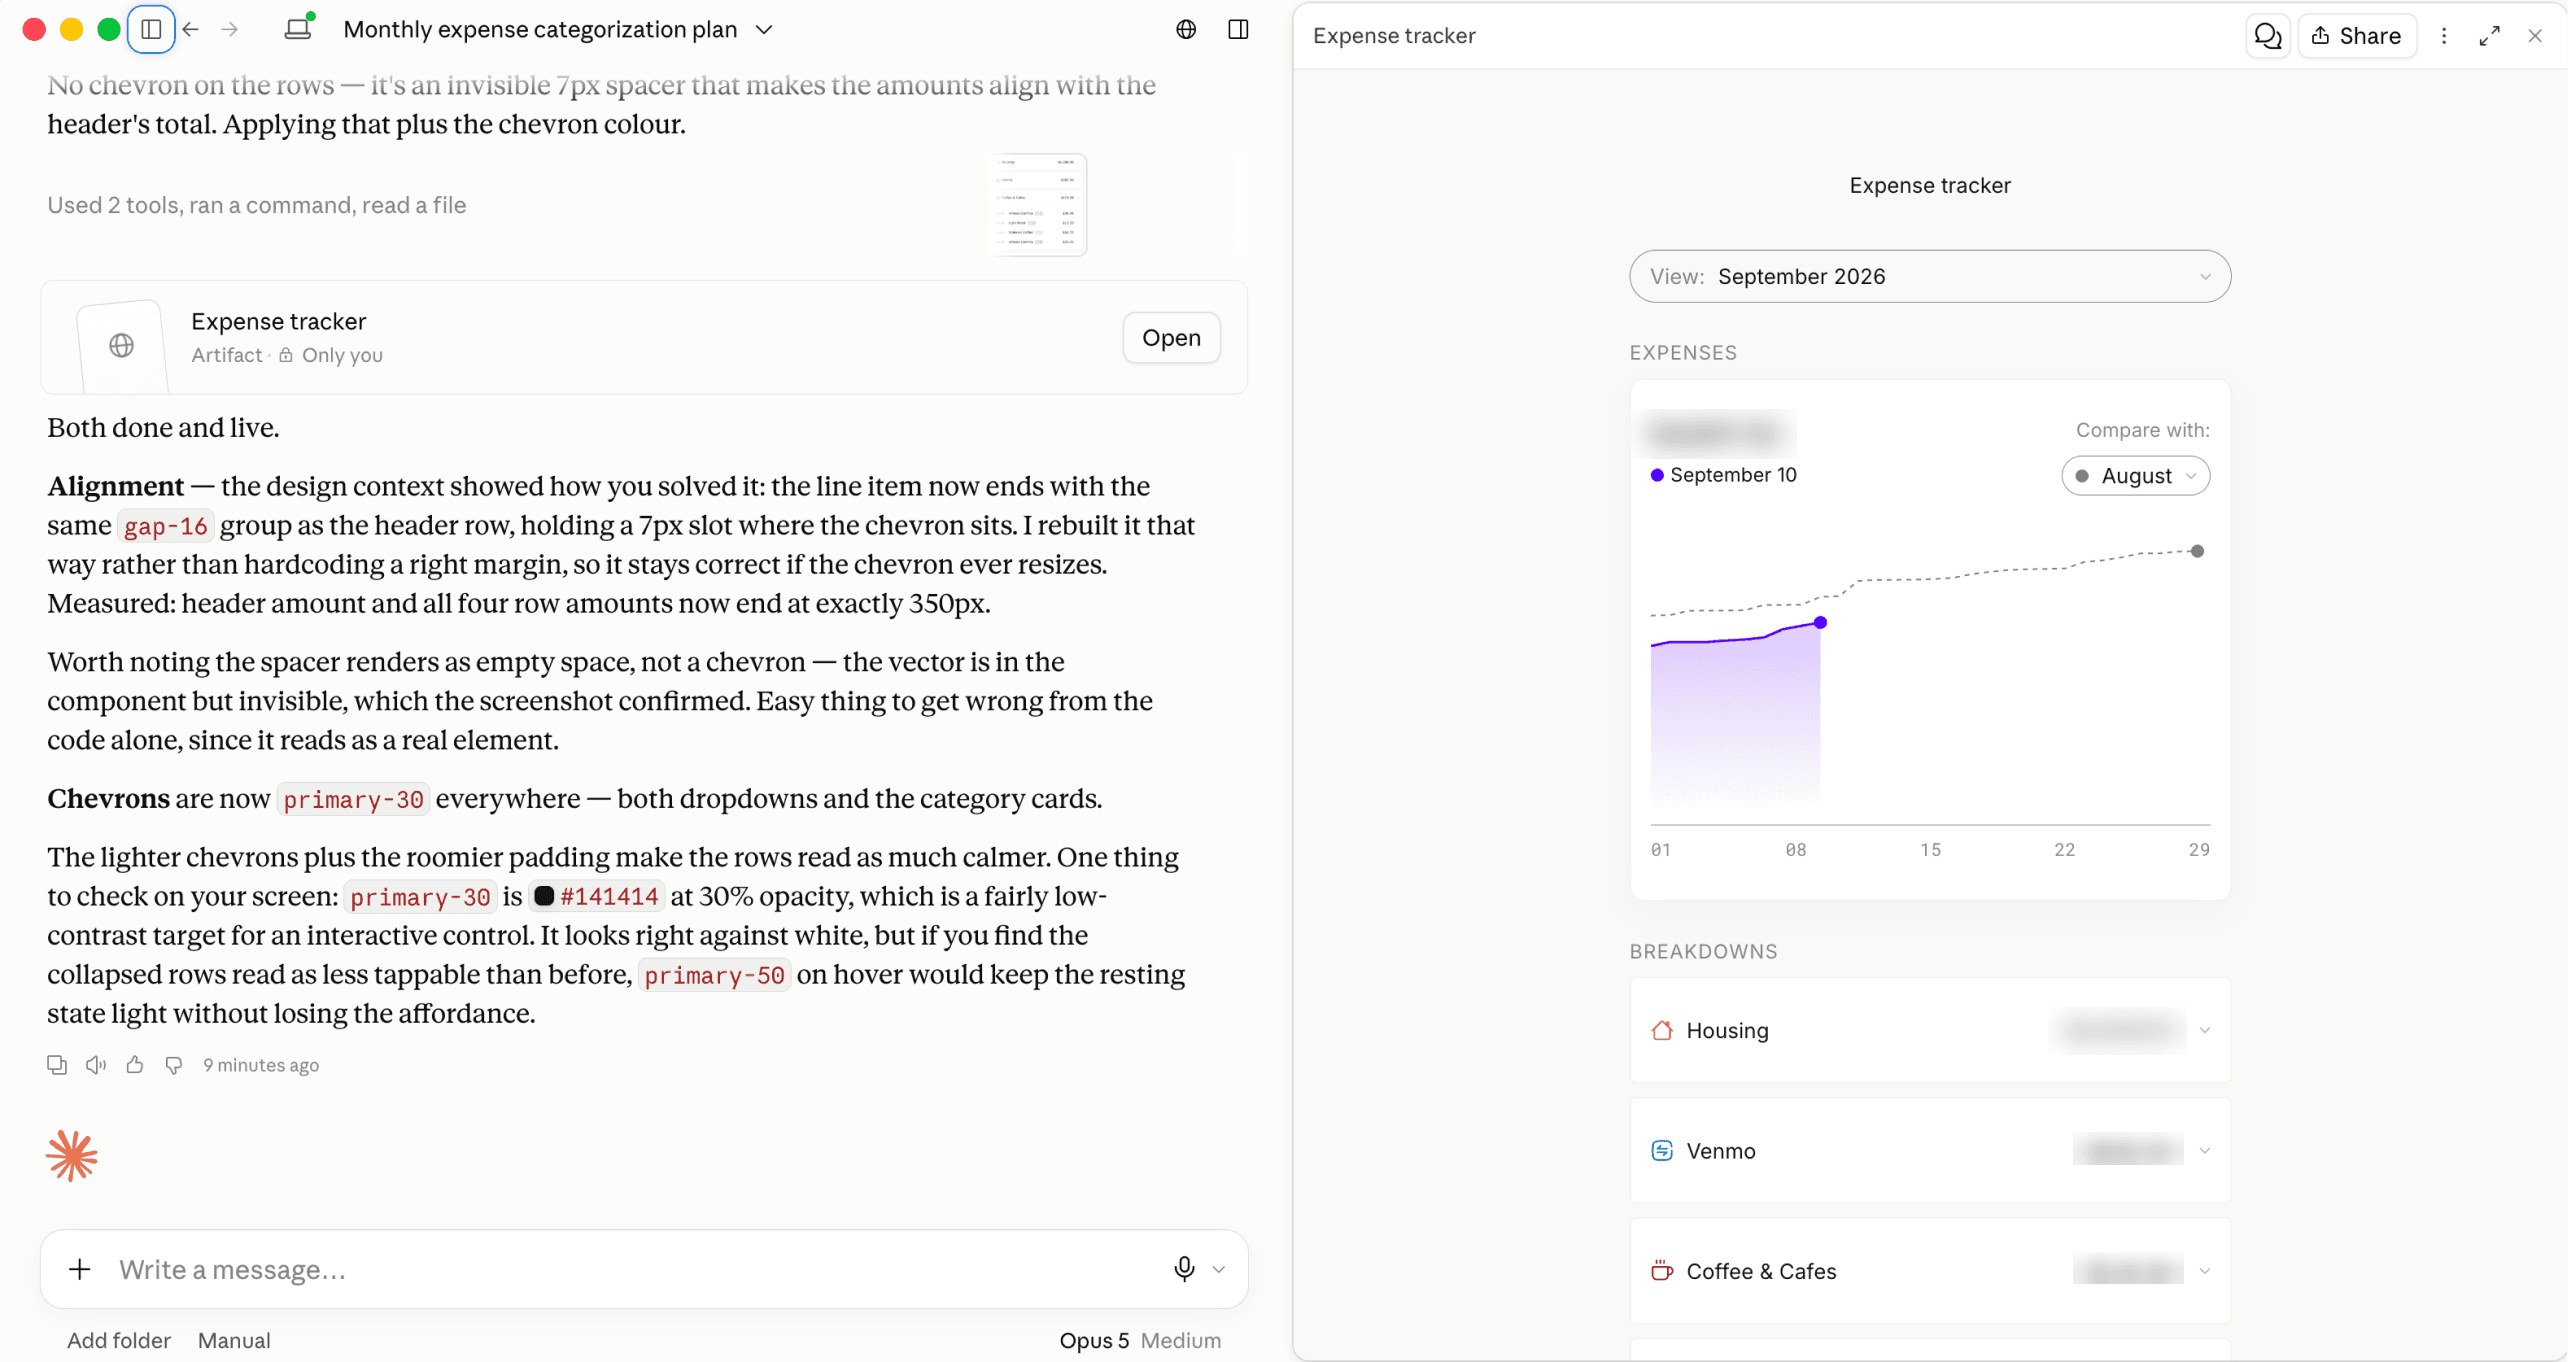
This is what the final output looked like.